Front-row seats: Luxury buyers pay a 25 percent premium to live on Central Park

In 2013 and 2014, the premium that buyers were willing to pay was much higher, 64 to 65 percent.
iStock
Buyers who want a Central Park perch have long been willing to pay a premium to live along those rarefied blocks. But the gap between the prices of those luxury apartments and the rest of the neighborhoods around the park has shrunk, according to a new report from PropertyShark.
The real estate data website found that in 2018, luxury buyers were willing to pay a premium of 25 percent to live on blocks bordering Central Park, making those apartments an extra $277,000 more expensive than apartments within park-adjacent neighborhoods.
The median home sale price of apartments along the first row of blocks was $1,400,000, compared to $1,222,500 within bordering neighborhoods.

Looking back at 2013 and 2014, when median sale prices for homes bordering Central Park were higher—$1,425,000 and $1,572,178, respectively—the premium that buyers were willing to pay was much higher, 64 to 65 percent, while median sale prices in nearby neighborhoods was much lower, $870,000 and $950,000.
The report slices the numbers in several different ways, such as comparing co-ops versus condos along the park. Condos hit peak pricing in 2015, when the median sale price reached $1.8 million, $758,469 more than the median sale price for apartments in nearby neighborhoods, a spike attributed to several pricey sales near the park.
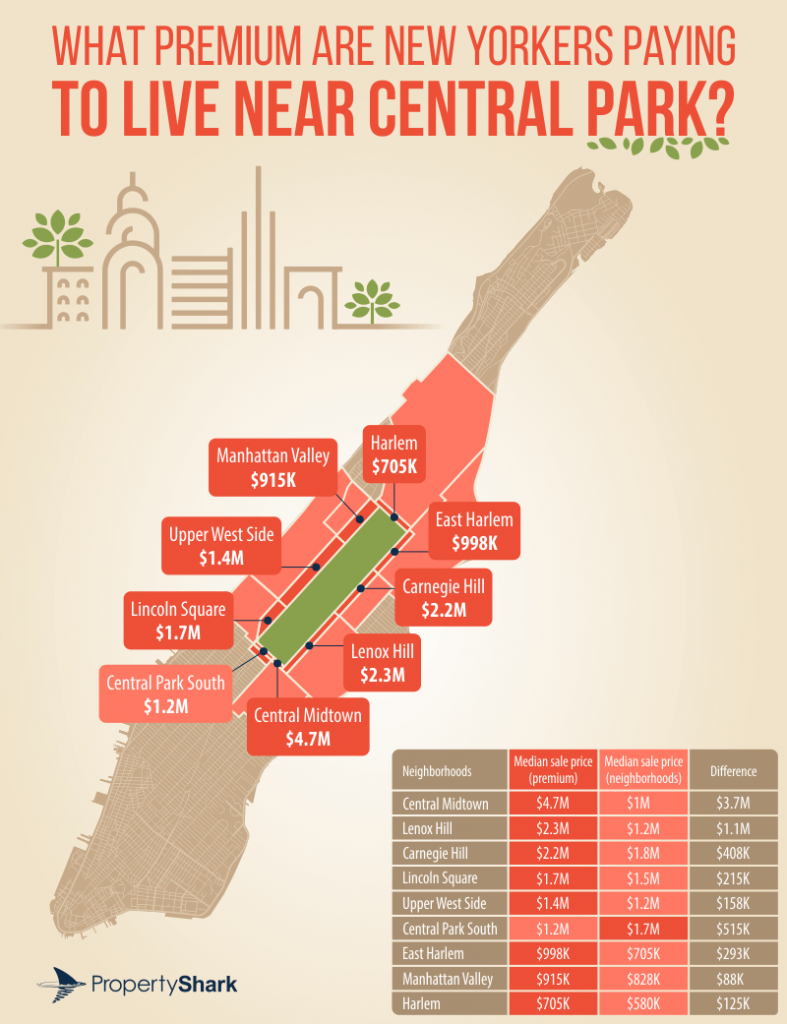
Want to know which neighborhood has the priciest park apartments? The report compares nine neighborhoods touching the park and found that in the Upper West Side, for example, there’s only a 13 percent difference between condos on the park and the neighborhood median. Central Park South was the only neighborhood that bucked the trend, with front row seats, or park-front apartments going for 30 percent less than the neighborhood median.
To come up with its data, the site calculated the median price of apartments located along Central Park, and the median home sale price of each neighborhood bordering the park. Only co-ops and condos were included. For 2018, sales between January and August were included. From 2013 to 2017, yearly sales were considered. Some numbers were rounded.
You Might Also Like

