How past election data might predict today’s Democratic primary results
In many past presidential elections, the New York state primary hasn’t carried nearly as much import as those in states like Iowa, New Hampshire, and South Carolina, where results are closely analyzed as predictors of what’s to come. This year, however, New York voters are being courted by the contenders: The 247 Democratic delegates who are awarded based on the primary outcome would be a boon to either Hillary Clinton or Bernie Sanders. (See LoHud for an explainer on the ins and outs of the New York primary.)
According to FiveThirtyEight, the poll analysis clearinghouse, Hillary Clinton has a 99 percent chance of winning the New York primary (for Donald Trump, the odds are even better.) The predictions are based on several polls, but for a deep dive into how NYC votes, turn to the CUNY Graduate School of Journalism’s NYC Election Atlas. The site, which notes that city voters make up half the state’s total electorate, contextualizes today’s Democratic primary with maps featuring data on how New Yorkers have historically voted across demographics and neighborhoods.
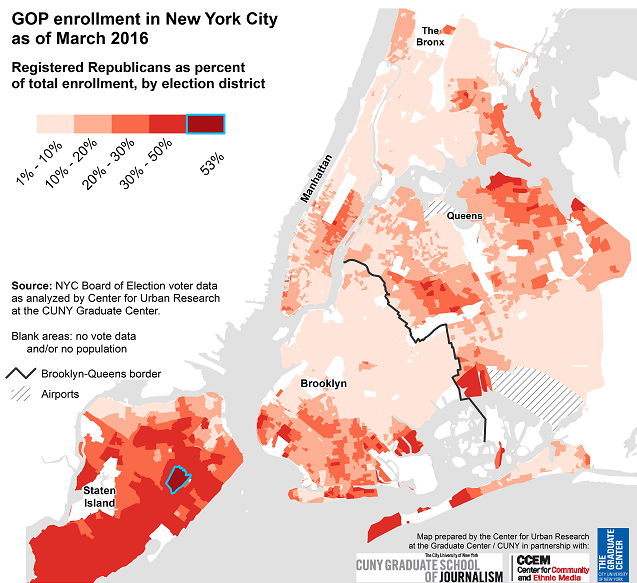
The site focuses primarily on the voting behavior of registered Democrats, though it does map GOP enrollment across the five boroughs (and notes that a mere 410,000 New Yorkers call themselves Republicans, compared to 2.7 million Democrats). The map suggests relatively high numbers of right-leaning voters in Staten Island, northeast Queens, and a few corners of Brooklyn, particularly Brighton Beach and Manhattan Beach.
Of particular interest is the NYC Election Atlas’ look at how NYC voted in the 2008 Presidential Democratic primary. Eight years ago, New York’s primary was held on February 5th, along with primaries in 24 other states. Though a majority of those contests favored Obama, Clinton won by a significant margin here. The Atlas map reveals that although Clinton is thought to have the support of more African American voters than Sanders does, in 2008, she fared poorly in many NYC neighborhoods where the majority of residents are black.
Atlas’ feature also reveals that the corners of the city in which Clinton enjoyed the strongest support—the Queens neighborhoods of Oakland Gardens, Douglaston, and Whitestone, for instance, as well as much of Staten Island—traditionally skew more conservative than other parts of NYC. Plus, a look at the 2008 youth vote indicates a poor turnout to the polls on the part of young New Yorkers, with an average voter age in most areas of 45 to 64 years old. Given this Washington Post report, which indicates that Sanders’ strongest base is in youth votes—that is, Americans under 30 years old—voting habits may have to change significantly this election cycle for his young supporters to shift the city’s primary away from Clinton.
The Election Atlas also notes parallels between the Clinton-Sanders faceoff and the 2014 race for governor between Andrew Cuomo—arguably, as the son of a former governor and a longtime state politician, the “establishment candidate”—and Zephyr Teachout, a writer and activist who told the Washington Post, “Look, I’m independent and I’m not afraid to stand up to the political establishment.” Two years ago, Teachout prevailed in neighborhoods like Williamsburg, Greenpoint, Long Island City, and much of downtown Manhattan, areas that tend to be affluent and left-leaning—which may mean these same parts of the city will include a high number of voters for Sanders today.
Whatever the results, today’s contest will yield a new slew of stats to sift through, further helping to make sense of a very opinionated city. And if you plan to vote, confirm that you are registered here, and check your polling location here.
You Might Also Like

