PropertyShark Map of the Month: Find Manhattan's best real estate deals

When you’re trying to get a handle on the Manhattan real estate market, it’s easy to get buried under an avalanche of numbers. Between average prices, submarket breakdowns, year-over-year changes and the rest, how can you tell what’s the most relevant data for your apartment search or sale?
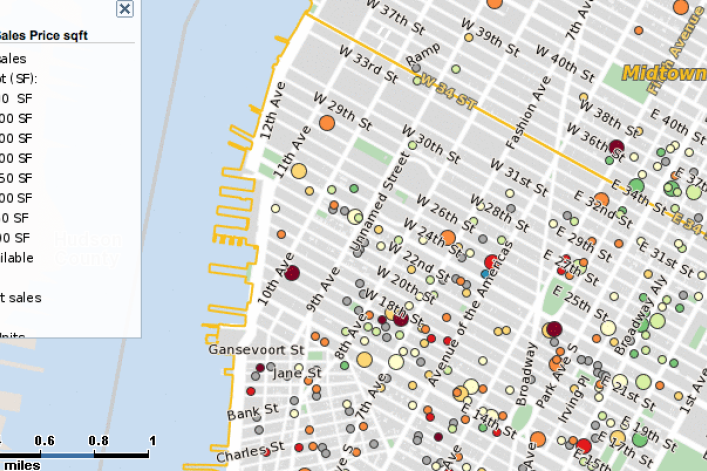
The folks at real estate data provider PropertyShark have charted Manhattan’s condo and co-op sales from the first quarter of 2014 on a nifty interactive map—making it easy to spot the areas where sales boomed, plus the affordable parts of even the ritziest neighborhoods.
To get the most out of the map:
The basics:
A new map comes out every quarter, with each transaction marked with a circle; it’s easy to zoom in to see deals on a specific block or zoom out to get the big picture.
The color of the circle shows the sale price per square foot, and the bigger the circle, the more sales took place in that building. Large dots typically indicate new developments, whereas bulk sales—where multiple units traded to a single buyer—have been eliminated.
Clicking on a dot or its corresponding parcel brings up a free mini report with details on individual sales, including which units traded, for how much and the median price per square foot of the sales. You can also see information on the building, such as whether it’s condo or co-op, the number of floors and units, or whether the building has commercial space.

Above: A free mini report associated with every building shows you transactions, prices and other useful info
Dig deeper into the mini report and you can you can find comparable sales in the area using the Find Comps (Radius Search) tool.
Click on View Full Report to get a detailed report ($9.95 each, or $39.95/month for 150 reports a month) that shows listings in the building, property tax data, violations and other useful information.
Buyers: find bargain areas
When you hear Tribeca or the Upper East Side, you may see only dollar signs. While it’s true that those are pricier nabes, you can still potentially find something in your budget.
By looking for clusters of green and blue dots—which indicate prices at $750 per square foot and under—you can identify areas where condos and co-ops traded for less. Or look for dots in your price range even in expensive parts of the borough.

Above: Even in pricey areas like the Upper East Side, you can pinpoint cheaper sales (represented here by green dots) to help guide your apartment hunt
If there haven’t been many sales in a particular building, that could indicate that units might be heading for the market soon. To keep an eye out for listings, you can add the property to a Watch List on PropertyShark and get notified whenever units in that building hit the market.
Sellers: value your apartment at a glance
If your neighbors sold their apartments in the first quarter of this year, you can see prices and other details by clicking on your building—a quick way to visualize comparable sales and help you price your apartment.
Likewise, you can quickly assess just how desirable units are in your building, letting you bump up the price accordingly.
PropertyShark.com is a real estate website that provides in-depth data for more than 75 million properties in New York City, Philadelphia, Los Angeles, San Francisco Bay Area, and other major US markets. The company covers most of the U.S. with a primary focus on the New York real estate marketplace. Click here to see what services and data are offered in your area.
More from PropertyShark.com:
Map of the Month: Unearth foreclosures and preforeclosures across NYC
Map of the Month: Toxic sites in New York City
Map of the Month: See every co-op and condo with a parking garage in NYC
Map of the Month: Where all the 311 complaints are
QuickTip: How to check for liens before you make an offer (and why you should)
How to buy an apartment that's not for sale
How to find the real owner behind an LLC
3 more ways to find the real owner of a NYC property
QuickTip: See how your property taxes stack up against your neighbors'


